


オープンソースのERP iDempiere(アイデンピエレ)2.0の新機能として、ウィンドウのフィールドにグラフを表示する事ができるようになったようです。
Display Type Chart
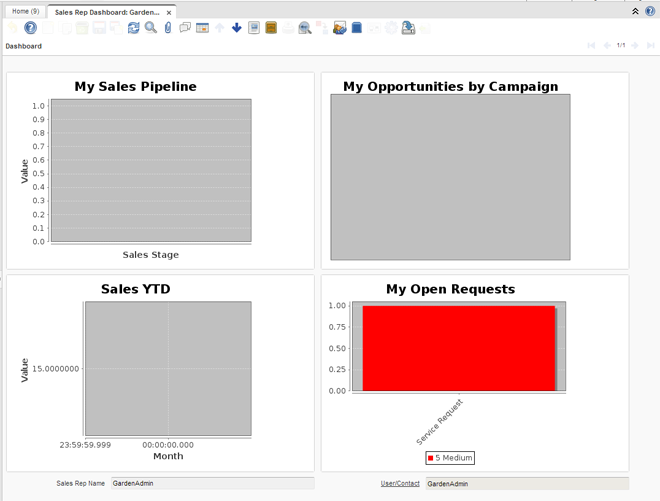
1つのフィールドにグラフを表示する事ができるようになりました。下記のイメージは4つのフィールドにグラフを表示したウィンドウになります。
アプリケーション辞書のパラメータ設定
テーブルとカラム - カラムタブ リファレンス

Chartの設定

【Chart Type】
- 3D Area Chart
- 3D Bar Chart
- 3D Line Chart
- 3D pie Chart
- 3D Stacked Bar Chart
- Area Chart
- Line Chart
- Pie Chart
- Ring Chart
- Stacked Area Chart
- Stacked Bar Chart
- Water Fall Chart

参考サイト
関連するコンテンツ
- 【iDempiere PJ Reports】Adaxa CRM
- iDempiere2.0の新機能
- 【iDempiere Lab】Payment Field(2013/11/17の研究日誌)